Summarizes the potential flood exposure of built infrastructure on which the community relies for services including wastewater treatment, energy generation, and transportation.

Adapting to climate change requires an understanding of potential hazards and exposure. These Municipal Snapshots provide easy access to information about the people, places, and assets that are at risk from climate impacts in each of New Jersey’s municipalities.
Summarizes the potential flood exposure of built infrastructure on which the community relies for services including wastewater treatment, energy generation, and transportation.
The Infrastructure report for MUN_NAME
Summarizes the potential flood exposure of critical facilities and assets that the community needs to provide education, care, and public safety to residents.
The Critical Assets report for MUN_NAME
Summarizes the potential flood exposure of natural and working lands, as well as sea-level rise impacts on coastal marshes (erosion and retreat) and public water access points.
The Natural and Working Lands report for MUN_NAME
Summarizes projected heat increases and the potential flood exposure of health-related sites including hospitals, nursing homes, and contaminated sites.
The Public Health report for MUN_NAME
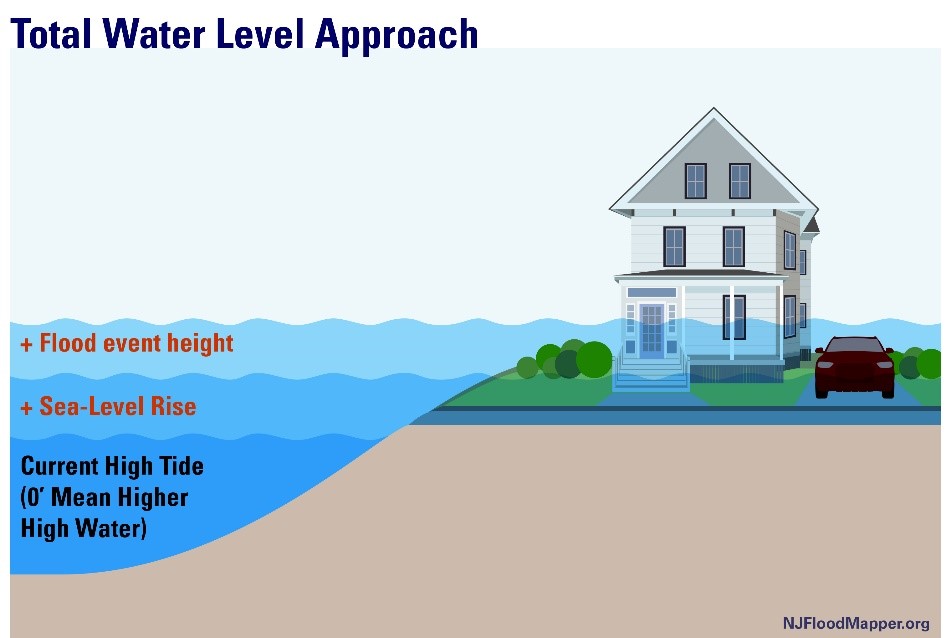
This Appendix provides additional background on sea-level rise and the Total Water Level approach for assessing vulnerability of people, places, and assets in New Jersey to sea-level rise and sea-level rise combined with storm events.
Sea level Rise and Total Water Level: From 1911 to 2019, the mean sea-level rose 1.5 feet along the New Jersey coast, compared to a 0.6 feet rise in the global mean sea-level. New Jersey coastal areas are likely to experience sea-level rise of 0.5 to 1.1 feet between 2000 and 2030, and 0.9 to 2.1 feet between 2000 and 2050.

Figure A-1. Total Water Level reflecting combined inundation from future sea-level rise and flood events.
For the purposes of the exposure snapshots, different flood events are defined by total water levels (TWLs). TWLs present a height above high tide (See Figure A-1) that reflects the combined inundation from future sea-level rise and current flood events projected into the future from the year 2000 (Kopp et al., 2019).
Flood events1 can occur from surge created by a coastal storm (such as a hurricane or nor’easter) or from high tide each day as sea levels rise. For example, a 2-foot flood event along the New Jersey coast today can occur because of seasonal ‘high-tide flood’ conditions. By 2050, the same 2-foot flood events will become more frequent, occurring under normal high-tide conditions and inundating the affected areas2. While flood events resulting from daily tides will result in permanent inundation (i.e., the water will not recede), coastal storm induced flood events last only for the duration of a storm. A 7-foot flood event along the New Jersey coast that approximates potential hurricane storm tides today will become more likely in the future as coastal storm surge occurs on top of an increased baseline of sea-level to create higher storm tides. You can use our tools at (NJADAPT / NJFLOODMAPPER) to develop custom water levels for your region.
1Flood events referenced in this document as examples reflect ‘total water level’ heights above Year 2000 Mean Higher High Water, consistent with the sea-level baseline datum. See Kopp et al., 2019.
2See Kopp et al., 2019 Appendix B for region specific high-tide flood frequency projections.
Extra space for a call to action inside the footer that could help re-engage users.
Summarizes potential flood exposure based on demographic data including socioeconomic status, housing, household composition, disability, minority status, language, and vehicle access.